How to justify ROI with increase in (not provided) for Agencies
- Rahul Doshi
- August 9, 2013
- 5 Minute Read

‘Estupendo‘ & ‘Mina de oro‘ are the two words what I call Google Analytics for any website owner. From small business owner or a hobby website to huge organizations, ecommerce giants, government websites or any political leaders; Google Analytics is so very useful and informative to analyze the trends and behavior.
Me, you, everyone in the universe was so happy getting best out of Google Analytics, till October 2011. Yes, it was 18th October 2011, Google Analytics introduced “(not provided)” and the only area [infact couple more like (not set) in paid channel, (Other) in content report] which started frustrating users.
Note:
The (not provided) is just for the organic search results and not for the paid search results.
Google enabled (not provided) 661 days ago. Since its announcement, it is at the highest pick. Below is the MoM(not provided) visits for one of my friend’s websites.

In July 2013 (not provided) captured almost 50K visits, whereas it was just around 10 – 50 visits for the initial couple of months.
Below are some of the challenges faced by the agencies:
- How to justify the ROI when compared with the spend on the organic efforts?
- Hard to manage resource allocation for different SEO efforts.
- Data loss in terms of organic keywords.
- How to highlight non branded keywords getting popular over branded in organic results?
- For clients who just broke the relationship with their old SEO company and switched to your agency – Hard to understand organic results and plan out the marketing strategy to have a great first impression.
Since the announcement of (not provided), there is nothing new I have discovered. Fortunately we have so many experts sharing their real experience and options to overcome (not provided). My core intention in this post is to cover best possible tricks (which was “actually” very difficult, as not each solution works once and for all).
How to get rid of (not provided)?
Well, the bad news is infact you cannot. Sadly, the urchins at Google have encrypted this data so right into the deep blue sea, but I am still keeping my fingers crossed.
So what are the options?
1. GWT Clicks vs. Analytics Visits:
This option was identified by Ben Goodsell on Search Engine Watch in March 2012. Google Webmaster Tools, is the 2nd set of data available (ofcourse once you link GWT in GA) that can help you to decide on most important and popular set of keywords. With GWT, you can check which keywords are used in Google and reported as (not provided).
Detailed guide is available here.
Conclusion:
I have heard and kept reading a very common belief within the SEO industry that GWT search queries can be dismissed as useless and imprecise. These are the best examples of how misinformation can guide people away from using a FREE, most valuable and powerful tool.
Stay away from such information. Download, categorize, trend and analyze is the best way to get the most out of Google Webmaster Tools. I have tested and implemented the solution provided above on one of my sites. And the outcome is awesome!
2. Overwriting (not provided) keywords in Google Analytics using a simple JS
This has been discovered by Ben Alvord on Moz in April 2013. This can work by adding a javascript in your website. Ben has tried to make it as simple as he can. You just need to follow these simple steps.
Conclusion:
As he mentioned in his article, use this script with a plenty of caution. I have not tried this so far in real, but looks very promising. I recommend to create a separate profile in Google Analytics and a dummy website (ofcourse should have some sort of organic traffic into it) to test this. Requires a moderate level of JS understanding. Without JS knowledge, it can screw up your entire test.
3. Based on your historic Google Analytics data, you can split the (not provided) traffic between brand and non-brand ratio to get an idea on what is growing? Brand or Non-brand. This is neither a hack nor requires any technical code knowledge.

Just follow the below simple steps and you are done.
- Create 3 advanced segments in GA i.e. Brand, Non brand and (not provided). Total Organic visits’ advanced segment is already available readily in Google Analytics.
- Get the data into Excel.
- Get the brand and non-brand visits in percentage.
- Based on the ratio you get of brand and non-brand visits in %. Split (not provided) data into brand and non-brand, considering the ratio of % as described in step #3. Below is how it will look like:

Annotations to take care:
Column 1: Months
Column 2: Total Visits – These are organic as (not provided) is applicable to organic results only.
Column 3, 4 and 5: Not Provided, Brand and Non-brand data are from Google Analytics Advanced Segments.
Column 6: Gross Visits = Total Visits – Not Provided
Column 7: Brand (%) = Brand Visits / Gross Visits (column 4 / column 6)
Column 8: Non-brand (%) = Non-brand Visits / Gross Visits (column 5 / column 6)
Column 9: Total Brand Visits = (Not Provided x Brand %) + (Brand Visits)
Column 10: Total Non-brand Visits = (Not Provided x Non-brand %) + (Non-brand Visits)
Conclusion:
I use this on a very broad level for my clients. Could be done very quickly and a quick win to check brand vs. non-brand visits growth against visits, sales, and revenue.
4. Google referral string to interpret (not provided) data
This is one of my favorites. Answers all the questions which I raised earlier in the post. This has been published originally by Dabython seomanontroppo.com in October 2012 and regenerated on Moz very recently by Timresnik.The author has tried to illustrate on how to reclaim (not provided) data in a much simpler way, though “some” and not the full.
The author was able to crack the ‘ved’ parameter in the Google referral string, which has to do with some magic in determining from which vertical (i.e. news, images, site-links, etc.) that result appeared from. Below is the screen shot showcasing how ‘ved’ parameter exposed!
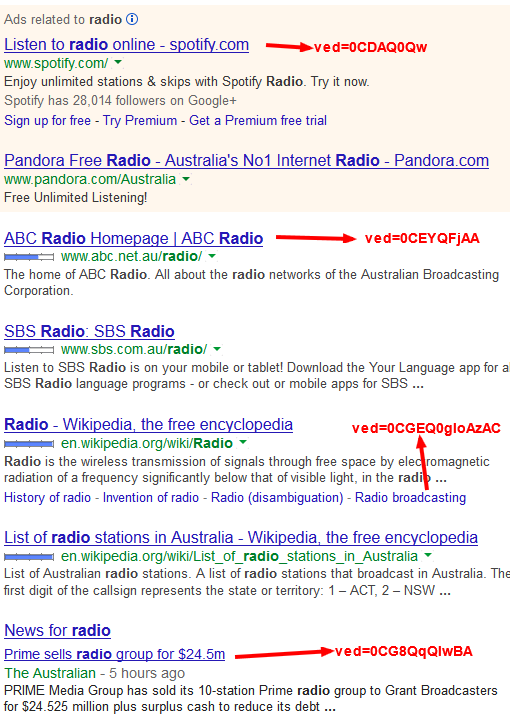
As now we are aware that it’s all about ved, which can do the magic, however there are few more ved parameters by moz author.

Now, we can create Google Analytics custom filters using above parameters and setting up proper naming convention. You can also refer the step by step process here
Conclusion (Agency centric):
This help agencies to calculate ROI and resource allocation for their different clients. As after implementing this trick, we will have definite sources i.e., news, images, site links, local, etc. This does not solve the problem, but exposes a few more variables to work with.
This wraps the post off with a hope that most of the people like me can refer any of the options mentioned above and get rid of (not provided) to some extent. I would love to hear from you guys, if there are any easy to implement ways though. In the meantime, I am planning to explore “The full value of mobile calculator“.